IDM, UD-3500, Carbon Black Dispersion Tester, 100x Magnification, LED Light
Scroll to zoom
100%
Description
Overview
Carbon black dispersion tester
Applies advanced reflected light microscopy and digital image processing techniques to provide a quick, easy, precise, and non-subjective carbon black macrodispersion assessment for rubber compounds
Both under-mixing and over-mixing increases costs of the manufacturing process
Image Input
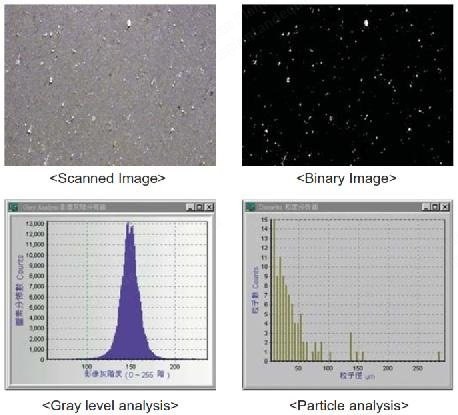
After placing the fresh cut sample onto the aperture with spring loaded specimen holder, the tester uses 30-degree angle of light to illuminate the specimen and scans the surface with 100x magnification
Bi-level analysis and pixels diameter analysis would be automatically computed with the captured image
Grey Level Analysis
Image brightness would be resolved into 256 grey levels for automatic bi-level thresholds determination
Bi-Level Analysis
The captured image would be transferred into binary (black/white) image after grey level analysis with digital image analysis technique
With the binary image, all dispersion analysis could be quickly carried out
Particle and Dispersion Analysis
Particle and dispersion analysis would be carried out based on ISO 11345 (methods C, D, and 3) and ASTM D7723
Built-in 5 sets, 4 kind of ISO Philip 10-scale standard:
Carbon black (CB) – 30x and 100x
Reinforcing carbon black (RCB) – 100x
Reinforcing carbon black with silica (RCB/silica) – 100x
Semi-reinforcing carbon black (SRCB) – 100x for automatic grading (x and y values)
Quantitative data of % dispersion and z% could be calculated automatically
Particle counts, particle diameters, particle area, particle ratio, and agglomerate counts are automatically acquired
Specifications
Magnification: 100x
Dimensions: l: 420 x w: 200 x h: 380 mm
Environment: 10°C to 40°C non-condensing
Electrical requirements: 110V 2A or 220V 1.2A
Pc System
IBM compatible PC with Windows 7, pre-installed dispersion analysis software, 19” LCD color screen, color printer
Operation and Data Management
Different positions of the specimen could be sampled per the user, and the average of multiple readings would be calculated for better dispersion assessment
Test results can be exported to Microsoft Excel format; users are able to edit or delete the saved data if authorized
Each testing result and captured image can be stored automatically
Request a Quote
✓
Request sent
Thank you, our team will reply to you shortly.
Direct access to our team
Email American Plant & Equipment
Tell us what you want to buy, source, finance, or sell. A machinery specialist will follow up with you.
✓
Thank you. Your request is with the American Plant and Equipment team.
A machinery specialist will follow up with you.
Machinery updates
Subscribe to our email list
Tell us which industries you follow and we will send you the machines that match.
✓
You are on the list.
We will email you when machines that match your interests come in. Unsubscribe from any message.